Continuing education: R
2024-04-11
1 Intro to R
1.1 General information on the course
Dear colleagues,
This online tutorial will accompany my seminar on “Continuing education for employees: R” at the IfKW (Ludwig-Maximilians-Universität München, SoSe2024).
For those unable to attend in person due to off-site obligations or caretaker duties, a Zoom link is provided here. I kindly ask that this option be used only under the above-mentioned circumstances, as providing comprehensive mentoring to online attendees can be challenging and a complex hybrid mode may slow down the course progress.
The seminar is open to everyone at all times, which means that you may attend at your convenience without any prior registration. However, whenever you decide to attend the seminar, it is imperative that you bring along a laptop so that you may test the R code yourself. Whenever you are unable to attend, this tutorial will be a helpful resource for catching up. Additionally, it provides the flexibility to review and study the material at your own pace. It can also serve as a useful reference book for those who are conducting their first research project in R and need to look up specific functions!
1.2 What can I learn from this tutorial?
After completing the entire tutorial, you will have acquired three important skills:
- Mastery of using R and RStudio for data management and analysis, which will replace SPSS at the IfKW.
- Understanding the benefits of using R over SPSS.
- Developing a P A S S I O N for working with R.
Each chapter of this tutorial consists of:
- an introduction to new functions/analysis methods in R, including corresponding R code
- main take-aways that you should remember
- information on additional tutorials / sources
- exercises to practice your new skills (you’ll often work through these with your colleagues)
1.3 Provisional schedule for this seminar
Day 1
- Morning Session (08.04.2024, 9.30 am, Room 115 Oet67): Introduction to the teaching
concept as well
as to R and RStudio. In this session, I will answer all of your
burning questions: How is the R course structured? How does it fit
into the transition to R at the institute? What packages (i.e., R extensions) will we be
working with? Additionally, I will demonstrate how to import a
dataset, manipulate it, and generate descriptive results with just a
few clicks using RStudio and the
tidyverse+tidycommpackages. - Lunch (12-12.45 pm)
- Afternoon Session (08.04.2024, ending 15.30 pm): Getting started with Base R. In this session, you will use R as a calculator, work with vectors, and learn to open datasets. The session is designed to help you recognize tutorials and answers in help forums that use Base R and distinguish them from those that use tidyverse R. Later on, you will only use tidyverse R, but you must be able to differentiate it from Base R to find helpful resources on the internet. If time allows, you will be introduced to the logic of the tidyverse metapackage for simplifying your data management.
Day 2
- Morning Session (09.04.2024, 10.00 am, Room 115 Oet67): Using the tidyverse metapackage for data management. Part I. Introduction to the logic of tidyverse metapackage for simplifying your data management. You will learn why the tidyverse is A W E S O M E and how easily it allows you to filter, group, and generate descriptions of data. You will also have plenty of time to solve exercises, i.e., to flex your tidyverse skills.
- Lunch (12-12.45 pm)
- Afternoon Session (09.04.2024, ending 15.30 pm): Using the tidycomm package to do a quick inspection of new datasets, rescale variables, and run own analyses, e.g., perform significance tests. In this session, we will cover the usual inference tests that we teach our students: chi-square, t-test, ANOVA, and linear regression. We will also have a look at Pearson’s r and partial correlation, of course.
Day 3
- Morning Session (11.04.2024, 9.30 am, Room 131 Oet67): Using the
ggplot2package for data visualization. Introduction to the grammar of graphics to create beautiful, publication-ready graphs. You will learn how to create advanced graphs that will enhance your publications. You will also have plenty of time to solve exercises, i.e., to flex yourggplot2skills. - Lunch (12-12.45 pm)
- Afternoon Session (11.04.2024, ending 15.30 pm):
Two options:
- We will solve an exercise that covers
dplyr,ggplot2, andtidycomm. This allows you to recap everything that you’ve learned throughout this seminar. - This last, advanced tidyverse session will cover advanced tidyverse operations that we do not teach to our Bachelor students, but that will make your own life as a researcher S O M U C H more enjoyable. These are topics like reading in multiple datasets, merging them, selecting and renaming multiple columns, or applying a function across many columns.
- We will solve an exercise that covers
Note: In the event of any delays or a particularly clever audience ;), changes to the schedule may occur.
1.4 What can I do if I have problems with my R code?
Besides asking me during the course ( :) ) there are some great places to have a look at when you encounter problems. To give you a head start, here’s a quick rundown of the three best places to look if you have a problem with your code:
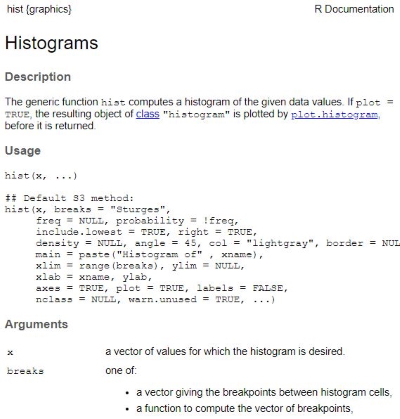
- R’s integrated help function: Use the ?-function whenever possible. Let’s assume you struggle with creating a histogram for your data (hist function in R). You can open the R documentation of the hist function in R by writing:
| Preview of ?hist in R: |
 |
- Search engines: Like Bing or Google. Yup, those who work with R keep googling all the time! Nobody knows all the code and errors by heart. Often you can find perfect answers to your questions on Stackoverflow, StatsExchange, or Rseek because other people had exactly the same problems. And more importantly, the communities on these websites are very friendly and helpful.
- Packages’ reference manuals: Finally, problems with R packages (we’ll get to packages later, see: Packages) can often be solved by looking at their reference manuals (an overview document containing all of a package’s functions). For example, you can learn more about dplyr (a data management package that we are going to use later in this tutorial) by visiting its reference manual on “CRAN” (Comprehensive R Archive Network), which is R’s main repository: https://cran.r-project.org/web/packages/dplyr/dplyr.pdf.
That’s everything there is. I hope you find my class and this tutorial to be a valuable resource on your journey with R. I did not take the easy road to learning R, so I am really looking forward to show you the quick way! I’ve tested (a variation of) this tutorial on 4 classes of BA and MA students in Zurich and Munich before, so don’t be afraid: You got this!
Let’s now begin with our first tutorial: Tutorial: Installing & Understanding R/R Studio